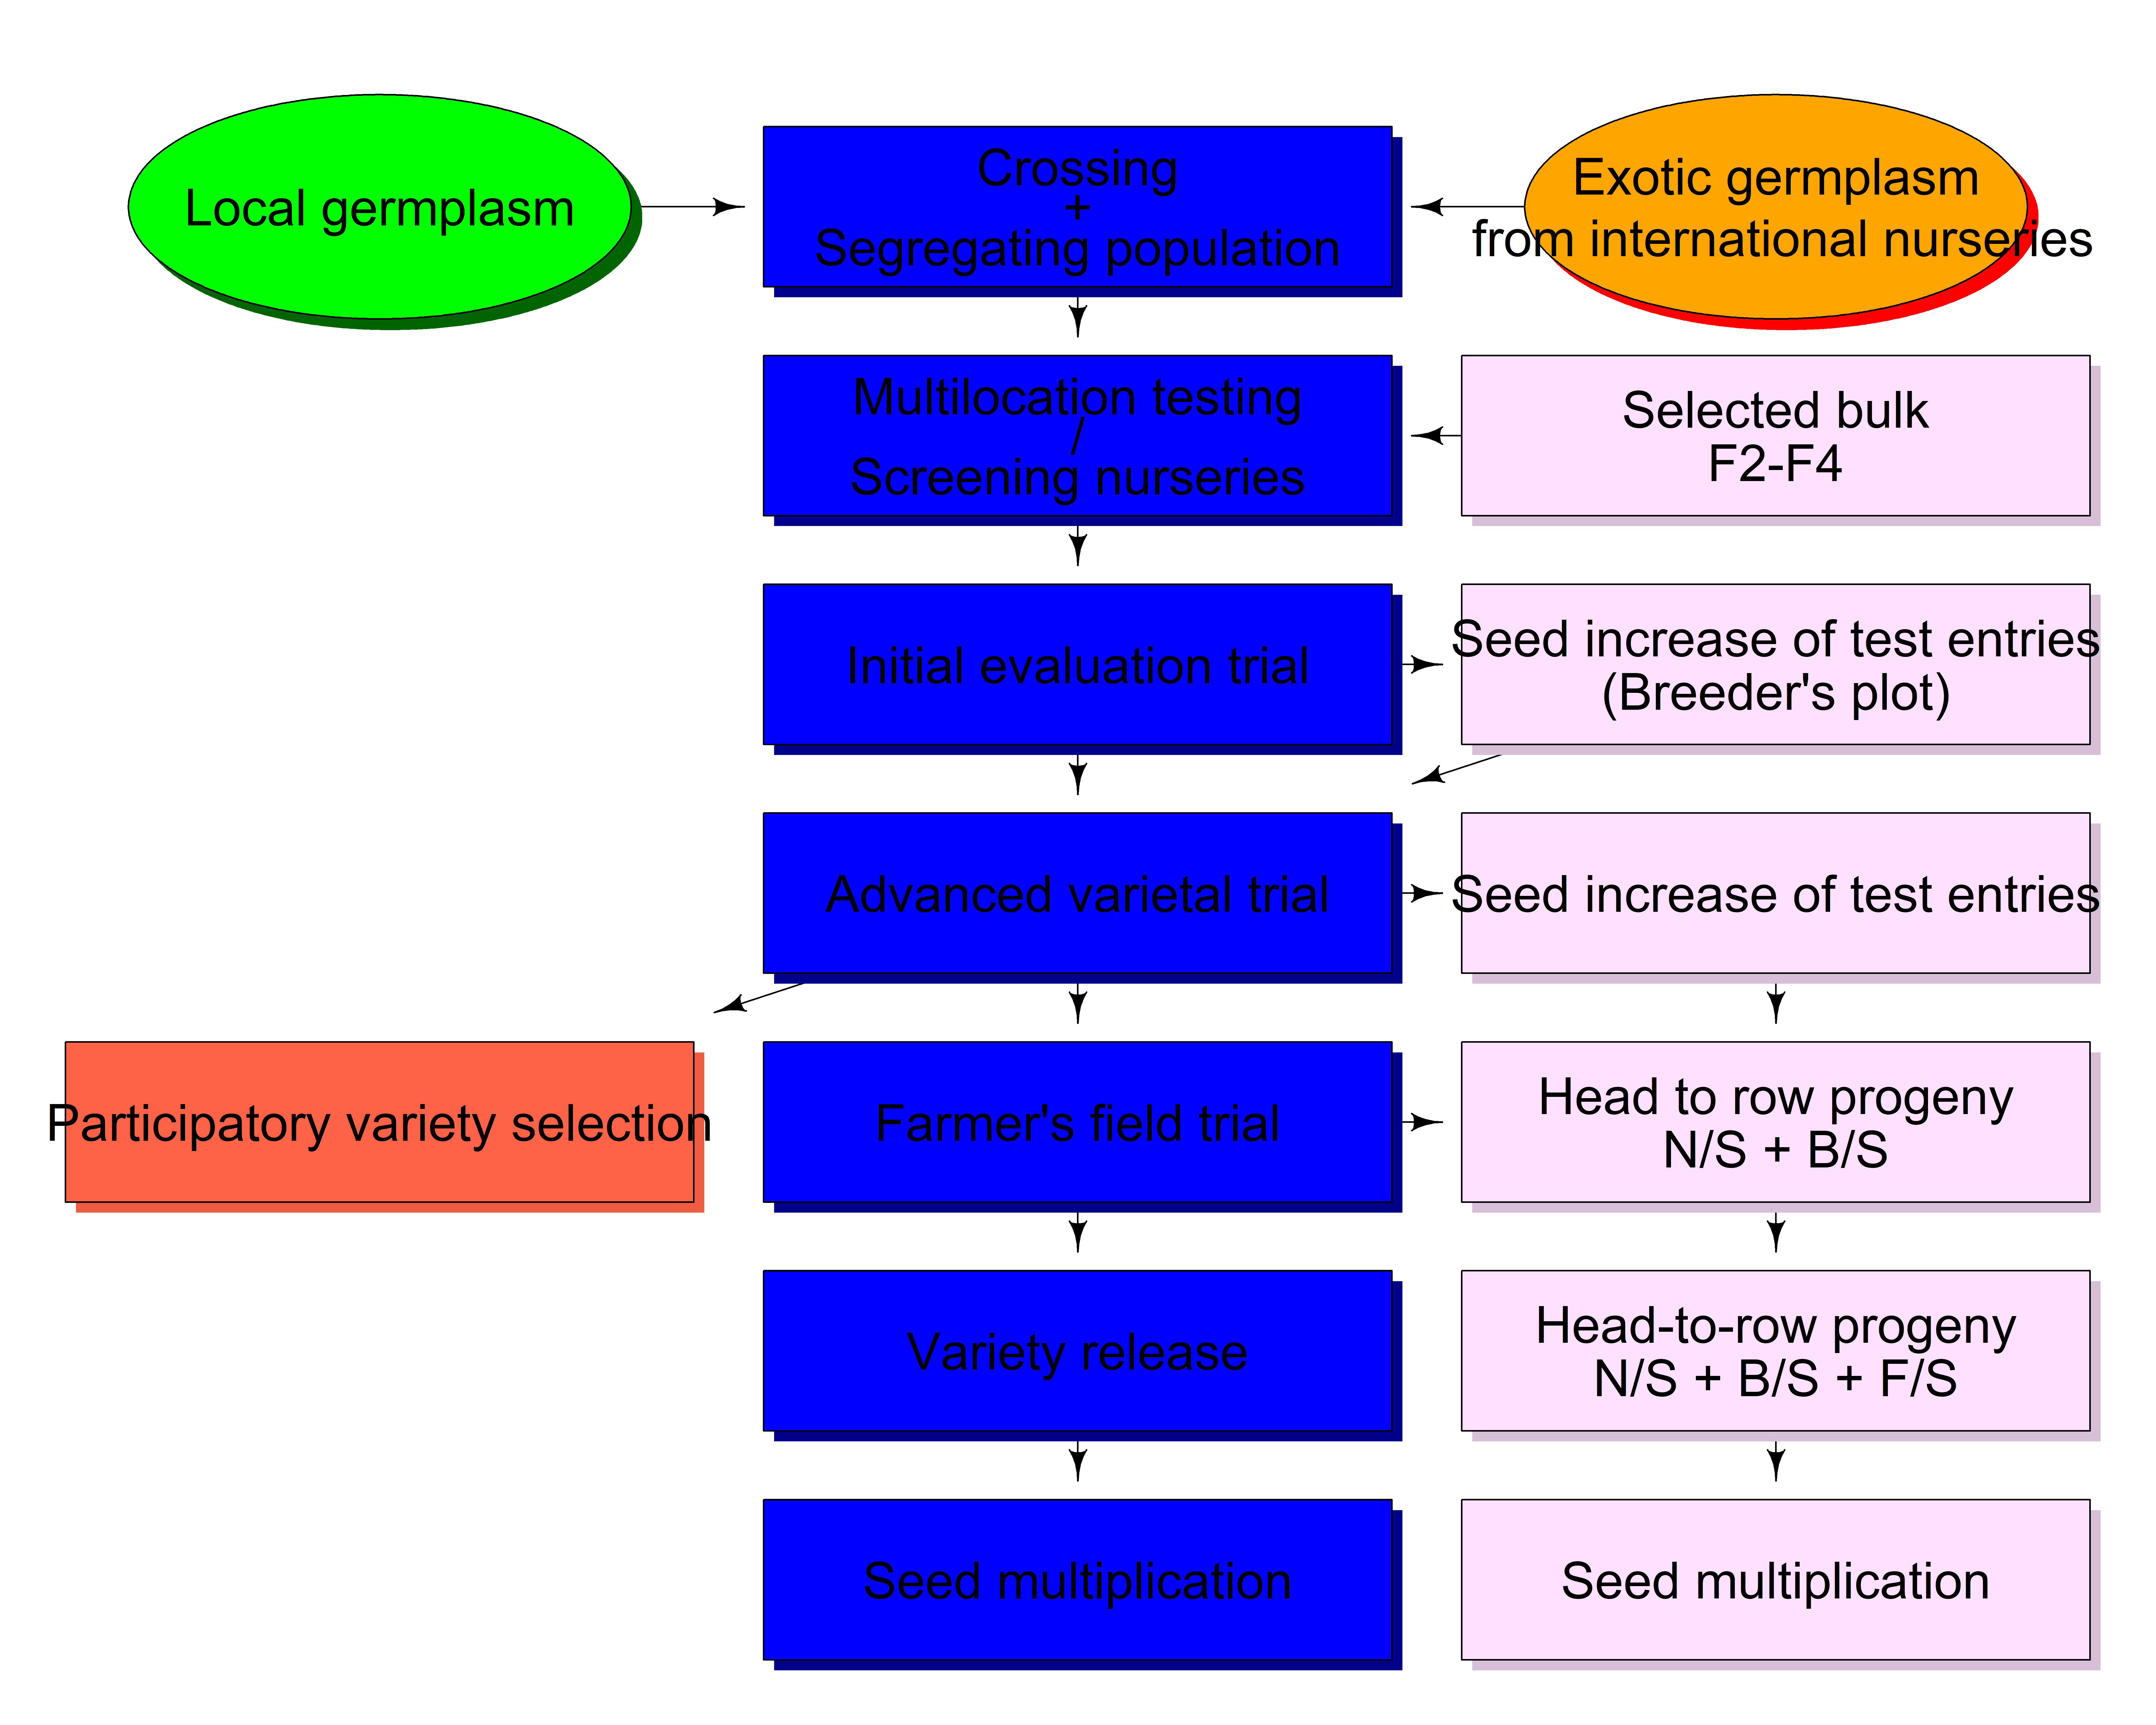
Developing flowcharts: an illustration of wheat breeding scheme
By Deependra Dhakal in Plant Breeding R
November 4, 2018
Flow diagrams are jam-packed with information. They normally describe a process and actors that are involved in making that happen.
With r package diagram, which uses r’s basic plotting capabilities, constructing flowcharts is as easy as drawing any other graphics.
This post expands on creating simple flowdiagrams using example scenario of a wheat breeding program. The information for this graph was, most notably, deduced from those provided by senior wheat breeder of Nepal, Mr. Madan Raj Bhatta.
suppressPackageStartupMessages(require(diagram))
## Warning: package 'diagram' was built under R version 4.2.3
## Wheat breeding ##
## flow diagram template ##
par(mar = c(1, 1, 3, 1))
openplotmat()

# position in whole page from top to bottom
elpos <- coordinates(c(3, 3, 3, 3, 3, 3, 3)) # how many columns of graphic shape to adjust in each row, also implies alignment

from_to <- matrix(ncol = 2, byrow = TRUE,
                  data = c(1, 2, 3, 2, 2, 5, 6, 5, 5, 8, 8, 9, 8, 11,
                           9, 11, 11, 12, 11, 13, 11, 14, 12, 15,
                           14, 15, 14, 17, 15, 18, 17, 20, 18, 21))
nr <- nrow(from_to)
arrpos <- matrix(ncol = 2, nrow = nr)
for (i in 1:nr)
  arrpos[i, ] <- straightarrow(to = elpos[from_to[i, 2], ],
                               from = elpos[from_to[i, 1], ],
                               lwd = 1.0, arr.pos = 0.5,
                               arr.length = 0.4, arr.type = "curved",
                               endhead = TRUE)
textrect(elpos[2,], 0.15, 0.05,lab = c("Crossing", "+", "Segregating population"), box.col = "blue",
         shadow.col = "darkblue", shadow.size = 0.005, cex = 2)
textellipse(elpos[1,], radx = 0.12, rady = 0.07, lab = "Local germplasm", box.col = "green",
            shadow.col = "darkgreen", shadow.size = 0.005, cex = 2)
textellipse(elpos[3,], 0.12, 0.07, lab = c("Exotic germplasm\n from international nurseries"), box.col = "orange",
            shadow.col = "red", shadow.size = 0.005, cex = 2)
textrect(elpos[5,], 0.15, 0.05,lab = c("Multilocation testing", "/", "Screening nurseries"), box.col = "blue",
         shadow.col = "darkblue", shadow.size = 0.005, cex = 2)
textrect(elpos[6,], 0.15, 0.05,lab = c("Selected bulk", "F2-F4"), box.col = "thistle1",
         shadow.col = "thistle", shadow.size = 0.005, cex = 2)
textrect(elpos[8,], 0.15, 0.05,lab = c("Initial evaluation trial"), box.col = "blue",
         shadow.col = "darkblue", shadow.size = 0.005, cex = 2)
textrect(elpos[9,], 0.15, 0.05,lab = c("Seed increase of test entries", "(Breeder's plot)"), box.col = "thistle1",
         shadow.col = "thistle", shadow.size = 0.005, cex = 2)
textrect(elpos[11,], 0.15, 0.05,lab = c("Advanced varietal trial"), box.col = "blue",
         shadow.col = "darkblue", shadow.size = 0.005, cex = 2)
textrect(elpos[12,], 0.15, 0.05,lab = c("Seed increase of test entries"), box.col = "thistle1",
         shadow.col = "thistle", shadow.size = 0.005, cex = 2)
textrect(elpos[13,], 0.15, 0.05,lab = c("Participatory variety selection"), box.col = "tomato1",
         shadow.col = "tomato2", shadow.size = 0.005, cex = 2)
textrect(elpos[14,], 0.15, 0.05,lab = c("Farmer's field trial"), box.col = "blue",
         shadow.col = "darkblue", shadow.size = 0.005, cex = 2)
textrect(elpos[15,], 0.15, 0.05,lab = c("Head to row progeny", "N/S + B/S"), box.col = "thistle1",
         shadow.col = "thistle", shadow.size = 0.005, cex = 2)
textrect(elpos[17,], 0.15, 0.05,lab = c("Variety release"), box.col = "blue",
         shadow.col = "darkblue", shadow.size = 0.005, cex = 2)
textrect(elpos[20,], 0.15, 0.05,lab = c("Seed multiplication"), box.col = "blue",
         shadow.col = "darkblue", shadow.size = 0.005, cex = 2)
textrect(elpos[18,], 0.15, 0.05,lab = c("Head-to-row progeny", "N/S + B/S + F/S"), box.col = "thistle1",
         shadow.col = "thistle", shadow.size = 0.005, cex = 2)
textrect(elpos[21,], 0.15, 0.05,lab = c("Seed multiplication"), box.col = "thistle1",
         shadow.col = "thistle", shadow.size = 0.005, cex = 2)

Figure 1: An overview of wheat breeding program in combination with rapid seed multiplication strategy
- Posted on:
- November 4, 2018
- Length:
- 3 minute read, 564 words
- Categories:
- Plant Breeding R
- Tags:
- R agriculture